
Ya know, $1.2 Million for a 2-bedroom apartment seemed a bit high, didn't it? DIDN'T IT?
Manhattan real estate may have hit a wall -- albeit a very high one. The last half of 2005 saw home prices lag, according to two new reports from Manhattan brokers.
According to Prudential Douglas Elliman, the median sale price for co-ops and condos in Manhattan rose just 1.3 percent in the fourth quarter of 2005, to $760,000. The Corcoran Group found that median sales price declined during the quarter, with a 4 percent slide.
Because Manhattan sales had soared during the first half of the year, however, gains for the full year were still hefty at more than 20 percent. In addition, both brokers noted an uptick in the market at the end of the year.
A two-bedroom apartment now costs a median average of about $1.2 million in Manhattan, according to Corcoran.
The Manhattan slowdown comes on the heels of similar drops in the third quarter in some of the nation's most expensive real estate markets. Boston and other Bay State areas, many California markets, the Washington D.C. area, and suburban New York counties, all recorded lower or flattening prices, according to National City, a financial holding company.
January 04, 2006
Manhattan real estate hits wall - Big Apple prices are treading water after years of big gains. Will the rest of the nation follow?


January 03, 2006
Question for HP readers: The Fed's interest rate moves appear to be winding down - what happens to housing when they stop?

Nice market rally on the news... but where will they stop - 4.75%? 5.00%?
And when they stop, will mortgage rates (and the 10 year T-bill) actually rise, as inflation fears take over?
And what do you think the Fed is targeting more - the housing bubble, or inflation?
Oh, Ben, it's gonna be a fun ride. Your boy Greenie has left you quite the conundrum.
Here's the housing quotes from their minutes today:
Although some scattered signs of cooling of the housing sector had emerged, the pace of construction activity and sales remained brisk
Activity in the housing market remained brisk despite a rise in mortgage interest rates. Starts of new single-family homes dropped back somewhat in October from September's very strong pace, but permit issuance remained elevated. New home sales reached a new high in October, and existing home sales eased off only a little from the high levels recorded during the summer.
Other available indicators of housing activity were on the soft side: An index of mortgage applications for purchases of homes declined in November, and builders' ratings of new home sales had fallen off in recent months. In addition, survey measures of homebuying attitudes had declined to levels last observed in the early 1990s.
2000: Corrupt analysts over-inflate stock values for brokers. 2005: Corrupt appraisers over-inflate home values for brokers

Classic bubble. Classic players.
Appraisers on the take, rewarded with future work by consistently delivering over-inflated appraisals, are just like the analysts in 2000 who were pumping stocks for their brokerage house when they knew the stocks were dogs.
This article from bubble-home San Diego looks at the corruption in the appraisal industry. This will be a great topic of course at the 2008 Senate hearings on the bubble. This "you rub my back I'll rub yours" flaw in the system was crucial for our current bubble to inflate to the point it did. With truly unbiased, independent and honest appraisers in the field, bubble buyers would never have been able to secure the financing they did. Here's some highlights (aka the low-lights):
As the San Diego real estate market cools off and home prices start to fall, local real estate appraisers say they are coming under intensifying pressure from mortgage brokers to provide inflated property valuations. It's an environment that has sparked an influx of proposed legislation both nationally and statewide.
And this paper from earlier in 2005 documented flaws in the system:
Serious conflicts of interest pervade the mortgage industry. Lenders, brokers, and real estate agents often have an incentive to inflate the value of residential properties. The process of appraising a property - among the most important steps in either the purchase or refinancing of a home - is sometimes done dishonestly as appraisers go along with requests to overstate the value of a home
Appraisal fraud can lead homeowners to borrow more money than their homes are worth, putting themselves at risk of being "upside down" in a home - e.g., not being able to sell for a high enough price to pay off their mortgage - even if there is no downturn in the real estate market.
And here's some classic emails from Henry Blodgett, the corrupt Merrill Lynch internet analyst. Substitute "stock" for "house" and you can just picture some conversations between home appraiser and mortgage banker today
Just do the math: If the market reverts to the mean, housing in California susceptible to a stomach-lurching 42% drop
Every market trend will over time gravitate toward the mean.
Every trend.
Fight it. "It's different this time" they'll say.
It's not. It never is.
Good article on this in the Realty Times - highlights here:
In his November, 2005 edition, Campbell writes, "Creative financing can be very dangerous when the price of the asset loses significance. People start believing that it doesn't matter whether a home sells for $200,000 or $400,000 because the monthly payment is the same. Sorry, but when mortgage loans are based on fictional values as opposed to true values that are supported by economic fundamentals, financial bubbles can develop that eventually implode."
Markets are mean-reverting, which he says explains why booms are followed by busts
In September 2005, the median price of a CA home was $544,000 and the median household income was $60,300. This puts the P/E ratio at 9.4, which is a level of extreme overvaluation based on 26-year norms. From 1996 to 2005, CA home prices rose by $366,000, a phenomenal 305 percent rise, while CA incomes rose by $17,000, a 40 percent rise."
To calculate how housing prices would fall if they were to revert back to the 26-year average for the P/E ratio, Campbell multiplies $60,300 by the average P/E ratio of 5.2. If the market reverts to the mean, housing in California should cost about $314,000, which makes it susceptible to a stomach-lurching 42 percent drop.
California homes have always sold for a significant premium compared to other U.S. homes -- 63 percent more since 1968. In Sept. 2005, the median U.S. home was $212,000. The same home in California should cost $346,000 (212,000 x 63 percent, add result to 212,000.) If the median home in CA is $544,000, the market is overpriced by $199,000.
January 02, 2006
Important NY Times Krugman Editorial: The overall market value of housing has lost touch with economic reality - and there's a nasty correction ahead
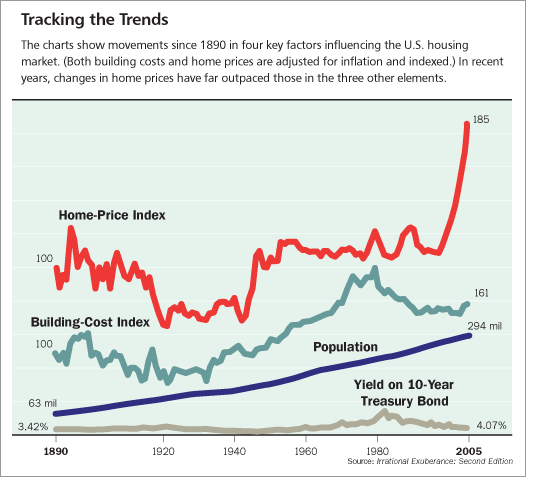 Excellent, reasoned opinion today by Krugman in the Times. I'll post the whole editorial here (thanks HP reader Susan). I highly recommend reading the whole article. I've added a great chart from Shiller to accentuate the point Krugman makes, that the market has detached from reality.
January 2, 2006
No Bubble Trouble?
By PAUL KRUGMAN
In spite of record home prices, housing in most of America remains surprisingly affordable, thanks to low interest rates. That fact may seem to say that there's no housing bubble. But it doesn't.
To see why, we need to brush up on our economic geography and economic history. Let's start with the good news. A report in last week's Times summarized the results of a study by Moody's Economy.com, a research company, comparing the cost of home ownership with family incomes.
The study found that for the nation as a whole, the cost of owning the median home is still only 23.7 percent of median family income, which is higher than a few years ago but well below the peak of more than 30 percent reached in the early 1980's.
Now for the economic geography. Last summer I suggested that when discussing housing, we should think of America as two countries, Flatland and the ZonedZone.
In Flatland, there's plenty of room to build houses, so house prices mainly reflect the cost of construction. As a result, Flatland is pretty much immune to housing bubbles. And in Flatland, houses have, if anything, become easier to afford since 2000 because of falling interest rates.
In the Zoned Zone, by contrast, buildable lots are scarce, and house prices mainly reflect the price of these lots rather than the cost of construction. As a result, house prices in the Zoned Zone are much less tied down by economic fundamentals than prices in Flatland.
By my rough estimate, slightly under 30 percent of Americans live in theZoned Zone, which comprises most of the Northeast Corridor, coastal Florida, much of the West Coast and a few other locations. So Economy.com's results on affordability aren't surprising: most families live in Flatland, and haven't seen a big rise in the cost of home ownership. But because Zoned Zone homes are much more expensive than Flatland homes, the Zone looms much larger in the housing story than its share of the population might suggest.
By my estimate, more than half of the total market value of homes in the United States lies in the Zoned Zone.And because home prices have risen much more rapidly in the Zone than in the rest of the country, the Zoned Zone accounts for the great bulk of the surge in housing market value over the last five years.
So if we want to ask whether housing values make sense, data on the median house nationwide are irrelevant. We need to focus on houses in the ZonedZone. And there the numbers are anything but reassuring.
In the Zoned Zone, the story that rising home prices have been offset by falling interest rates is all wrong: prices have risen so much that housing has become much less affordable. According to Economy.com, the cost of owning a home in the New York metropolitan area went from 25 percent of median income in 2000 to 38 percent today.
In Miami, the numbers were 21 percent and 42 percent, respectively; in Los Angeles, 31 percent and 55 percent.
Even so, the current cost of owning a home in the Zoned Zone isn't entirely unprecedented. Roughly similar percentages of median family income were needed to afford houses in the early 1980's. But that's hardly a comforting comparison, which is where the economic history comes in. You see, the unaffordability of housing in the early1980's led to an epic collapse in the housing industry. Housing starts fell from more than 2 million in 1978 to only 1.06 million in 1982. And the housing implosion was one of the main factors in the worst economic slump since the Great Depression, which brought the unemployment rate to a peak of 10.8 percent at the end of 1982.
It's also worth noting that the reason housing was so expensive in 1981 and1982 was that mortgage interest rates were extremely high. That made recovery easy, because all it took to make housing affordable again was for interest rates to return to normal levels. This time, with interest rates already low by historical standards, restoring affordability will require a big fall in housing prices.
So here's the bottom line: yes, northern Virginia, there is a housing bubble. (Northern Virginia, not Virginia as a whole. Only the Washington suburbs are in the Zoned Zone.) Part of the rise in housing values since 2000 was justified given the fall in interest rates, but at this point the overall market value of housing has lost touch with economic reality. And there's a nasty correction ahead.
Blame the Messenger: HousingPanic gets flamed by New York Times real estate blogger for saying housing bubble has burst

Damon (who generally writes a good blog) must have:
1) not talked to Krugman over the weekend about the column he was working on (see next HP posting)
2) ties to the real estate industrial complex
3) a nice $500,000 condo in NYC that he's worried all this negative-nilly bubble talk is gonna hurt it's appreciation
4) family members who are realtors
5) a boss who is telling him to protect the last few NY Times advertisers (that haven't gone to craigslist or the net) - the real estate listings
HP readers can comment here
Here's Damon's posting:
Believing Is Seeing
Scientists say that the human brain is wired to look for patterns in the chaotic data that assaults us throughout the day. The trouble is, we are not really good at telling what the pattern is. That’s why we see the face of Jesus in a grilled cheese sandwich or think that a stock graph that looks like a cup means the stock is a good buy.
Same goes for folks waiting for real estate prices to collapse. The bubble blog crowd does a great job collecting the data, but because they are seeing what they want to see, the pattern recognition may be off . (Or it might not be. My skepticism of pattern recognizers is based on drawing patterns from the past results of pattern recognizers.)
There are good examples of this pattern-seeking at the Marin Real Estate Bubble and Housing Panic and at BusinessWeek.
And this, from Housing Panic, has become a fairly common meme:
It’s here. Just read the headlines. Add it up. It ain’t brain surgery. The bubble has burst. Someone had to officially declare it, so let Housing Panic be the first.
“Yield Curve Inverts”
“New Home Sales Fall 21% in West”
“Gold Hits Record High”
“Median US Home Value Falls in November”
“Fed Raises 13th Straight Time”
“Phoenix Home Listings Soar”
“Tougher rules eyed on risky mortgages”
“Investors Moving out of Housing”
“Mortgage Applications Fall to 11-Month Low”
“Housing Slowdown May Claim 800,000 Jobs”
Pop. Tilt. Game over.
I’m still waiting for the hard evidence. – DAMON DARLIN
January 01, 2006
Get on the record for 12/31/06
Happy New Year HP readers... time to get on record with your thoughts for 2006.
On December 31, 2006:
1) What will be the Dow close?
2) What will the Fed Funds rate be?
3) What will be the year over year decline or increase in Median US Home Sale Price?
4) Forget Clinton and McCain - who will be the #2 leading Dem and Rep presidential candidates set to challenge them for the nominations?
Here's my answers:
1) 8800
2) 5.25%
3) -12%
4) Evan Bayh & George Allen
Any other soothsayer musings welcome


