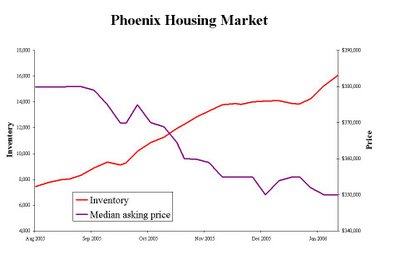
And how right they were...
Thanks for overvalued.blogspot.com for the chart
The Investment Game
Arizona RepublicMar. 13, 2005
Soaring home prices and sales have homeowners in metropolitan Phoenix tallying the rising equity in their houses.
Most Phoenix-area neighborhoods saw their biggest price increase ever in 2004, according to The Arizona Republic's Valley Home Values survey.
Half of the ZIP codes in the Valley posted double-digit appreciation gains. Many areas reported price jumps of 20% or more.
There's a downside to the recent run-up in the area's home values. A repeat of 2004's robust performance might be too much of a good thing for the Valley's housing market. Too many investors paying premiums for homes could push prices beyond the means of the area's residents and people considering moving here. A glut of investment properties turned into rentals could pull down values if owners can't find tenants and sell for a loss.
The pressure is on this year. If prices climb too high, the demand for homes will fall. Too many homes for sale and not enough buyers could drive down metropolitan Phoenix home values and deplete profits homeowners are banking on.
"The housing market has gotten so good, it's bad," said P.J. Dean, a real estate agent with Dean-Maldonado.
March 10, 2006
Phoenix March 2005 article: "The housing market has gotten so good, it's bad"
Posted by
blogger
at
3/10/2006
![]()
![]()
Subscribe to:
Post Comments (Atom)


11 comments:
chart clearly shows an UPSIDE-DOWN MORTGAGE !!!
Why pay for an overpriced property ?????
This chart is deceptive. The inventory graph and the price graph have been put on top of each other however, where they "meet" has no technical meaning as it is just how the editor chose to overlap 2 charts that use different scales.
the thinker said....
hey thinker come on over to PHX buy few investment prop then you see the rignt undeceptive scale.
R u stupid or something?
Actually if you take the "median" values for the 2 Y-axis criteria (median home price and inventory) for the given time period (Aug 2005 - Jan 15), those values would be centered vertically on each side of the graph. Thus, the overlap is not arbitrary.
For example, the median home price for the given time period was $365,000, and the median inventory level was around 11,500. For more info on those numbers, see: http://www.benengebreth.org/housingtracker/location/Arizona/Phoenix/
there's the city of phoenix (which this shows) THEN there's maricopa county - that's phoenix, tempe, scottsdale, chandler, etc etc. that's the one where we're heading to 40,000 listings
Left Las Vegas is right, the scales are not arbitrary they are centered. However, my point is that you cannot look at this chart and say "the asking price has fallen below the inventory level" because these two scales are different.
This chart shows that while asking prices have been declining, inventories have been rising, but usually in economic charts, the location where two curves intercept is meaningful. However, if each curve represents a different scale than the point where they meet has no significance because if the graph were scaled differently the interception date would change.
My comments were aimed at bpl_200_mbps's statement that this chart "clearly shows that mortgages are upside-down."
I don’t know why Anonymous thinks this is stupid. I never said the housing market in Phoenix was in good shape (because it is not) or that I would buy an investment property there (because I wouldnt).
If he made the time frame of the chart from August to March 1 (instead of Jan 15), the chart would actually look worse. The median home prices have been stubbornly flat, while inventories keep piling up at record levels.
The benengebreth.org site does underreport inventories because he doesn't include some of the outer suburbs, but nonetheless it's clear those numbers are proportional to the actual inventory trends of those metros.
One chart I'd really like to see is median asking versus actual (closing) prices - I'd expect to start seeing a widening divergence between those lines.
CraigsList keywords to have fun with:
"Desperate"
"Urgent"
"Motivated"
Check out the price reductions on this recently completed spec home in suburban Phoenix. 4 bedrooms, 2 baths, just under 2400 square feet. I wonder what will happen on the Ides of March.
Price Reduced: 03/05/06 -- $319,088 to $294,088
Price Reduced: 03/10/06 -- $294,088 to $279,088
Complete spec-home. Fully upgraded with maple or cherry cabinets-raised panels, crown molding, roll out trays. 16x16' or larger tile in kitchen, nook, entry, bathrooms, and utility. Upgraded carpet and pad. Recessed lights in kitchen and nook. Ge washer, dryer, and refrigerator (gas or electric per plan), gas stub out to range and dryer; structured wire with phone and cable; ceiling fan pre-wire in all bedrooms, great room, bonus room and family room (per plan).
Phoenix looks inexpensive compared to the Bay Area. Surprised to see Phoenix fall before the Bay Area.
Sweet!!
Phoenix goes down first!!!!
Post a Comment